
From dashboards to decisions: why practical data skills are becoming essential in modern Finnish business education
Published : 18.06.2026 / Publication / Blog
Finnish business life is becoming increasingly data-driven, and future professionals need more than theoretical knowledge about digital transformation. Practical Power BI work can help students connect data, sustainability, customer behaviour and managerial decision-making in a modern business learning environment.
Background
With the rapid digitalisation of Finnish companies, the question of whether students can use data to understand business problems, evaluate evidence, and make responsible recommendations is becoming increasingly important. According to Statistics Finland (2025), 38% of Finnish enterprises used artificial intelligence technologies in spring 2025. Additionally, Statistics Finland shows that 79% of enterprises used cloud services, 58% used Enterprise Resource Planning systems, 43% used Business Intelligence software, and 45% performed data analytics (Statistics Finland, 2025). These figures show that data tools are no longer limited to technology companies, but rather they are part of normal business practice.
At the same time, digitalisation alone does not guarantee better decisions (Brynjolfsson & McElheran, 2016). A company may have ERP systems, dashboards, customer data, and AI tools, but still lack the competence to interpret data critically and make managerial decisions. This creates a clear task for business education - students need to learn how to move from data to insight, and from insight to action.
Why data skills matter in the Finnish labour market
Finland has a strong digital profile. The European Commission (2024) reports that 85.6% of Finnish SMEs have at least a basic level of digital intensity, which is clearly above the EU average of 69.1%. It also reports that above 79% of Finnish enterprises use cloud services, artificial intelligence, or data analytics. These numbers indicate a business environment where digital competence is becoming a normal expectation.
Yet the labour market is not simple. Job Market Finland (2026) reported an employment rate trend of 75.3% for people aged 15 to 64, 333,200 unemployed persons, and 37,000 new vacancies in its May 2026 update. These figures show a labour market where employability and skills alignment matter. Graduates need qualifications, but they also need practical skills that employers can recognise.
The OECD (2020) has also emphasised that Finland’s skill development system must adapt to technological change, population ageing, and changing job requirements. Digital and meta-cognitive skills are becoming more important in working life. This is an important shift for universities of applied sciences (UAS). UAS’s role is not only to transfer knowledge, but also to prepare students for changing professional tasks. For business students, practical data skills are therefore an essential part of professional competence.
From digital tools to data-informed judgement
Data literacy is more than the ability to work with data charts. Ridsdale et al. (2015) describe data literacy as the ability to collect, manage, evaluate, and apply data critically. This definition is useful for business education because it includes judgment. Interpretation of data requires business understanding, methodological awareness, and critical thinking. Evidence-based management follows the same logic. Rousseau and McCarthy (2017) argue that management education should help students use evidence while developing professional judgement. In other words, future managers should not rely only on intuition, but rather they need to combine evidence, context, and ethical responsibility (CIPD, 2025; Provost & Fawcett, 2013).
A course project built around the full data-to-decision process
At Arcada, within the framework of competence development, we have been interested in finding solutions that bring together Arcada’s pedagogical principles of student-centred, working-life-oriented learning with the development of practical analytical skills. One example is the course on data-driven decision-making in business, where students worked on a practical group project. The project asked students to take the role of a sustainable business development team. Their task was to study one of the given Nordic textile companies, analyse business data, collect customer data, visualise findings, and develop recommendations for management. The project was designed around a full data-to-decision process. The structure of the project did not treat data analysis as a separate technical activity. Instead, data analysis was connected to business strategy, sustainability, consumer behaviour, and managerial decision-making.
Power BI was used in the course as a practical learning environment. Microsoft (n.d.) describes Power BI as a platform for connecting, visualising, and sharing data. In the classroom, however, its value lies not only in the software itself but also in the learning process around it. The process of dashboard creation requires students to make multiple tactical and strategic decisions to obtain the most accurate and unbiased business insights (see an example in Figure 1). Which variables should be included? How should the data model be structured? What type of chart is suitable? Which visualisation supports the business question? What information should be highlighted, and what should be left out? These decisions require reasoning, reflection and professional judgement.
A weak dashboard may look attractive but fail to support a clear conclusion. A strong dashboard helps the reader understand the business problem, the evidence, and the recommendation. It creates a connection between analysis and decision-making.
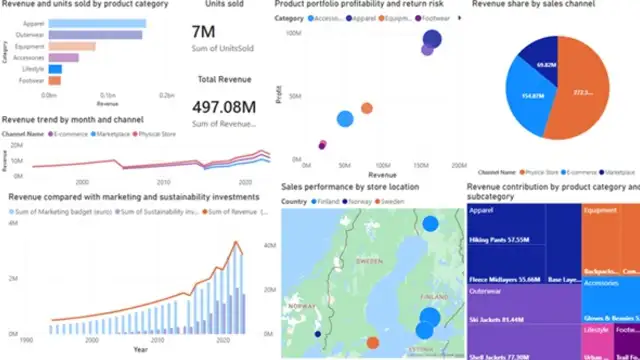
Figure 1. An example of a Power BI dashboard from the students’ project, showing different aspects of the company data
Data skills and the Finnish data economy
The course also connects with broader Finnish business development. Business Finland (2025) describes its Data Economy programme as a way to help Finnish companies renew their business and use data for international growth. The programme especially targets companies that want to build new data-driven solutions and strengthen competitiveness. The Ministry of Economic Affairs and Employment of Finland (n.d.) also frames the data economy as a source of business innovation, growth, and data-based value creation. This shows that data competence is not only an educational issue, but it is also part of Finland’s economic development agenda.
Sitra (2024) makes a similar argument at the European level. It emphasises that data-driven business models can support productivity, innovation, human well-being, and environmental goals. Sitra also highlights the role of SMEs and the need for skills that allow companies to build sustainable data-driven businesses.
This is highly relevant for Finnish business education. Many students will work in SMEs, public organisations, start-ups, or international companies operating in Finland. They may not become data scientists. Still, they will need to understand how data can support better business models, customer understanding, sustainability work, and operational decisions.
Student reflections on the group projects
The course was completed in spring 2027 at the Business Management and Transformation Master’s Program. The student reflections were collected voluntarily after the completion of the course to capture students’ retrospective views on the learning process. The student reflections on the course project show that Power BI was not experienced only as a technical tool. It became a way to structure business thinking. Across company projects, students used dashboards to examine revenue from multiple business perspectives and identify patterns that were not immediately visible in the raw data. For example, one student described how the strongest learning came from connecting several forms of evidence:
“In our project, Power BI helped us compare revenue drivers by product category, sales channel, region, units sold, average selling price, and gross profit. We learned that the strongest insight came from connecting the ERP dashboard with the regression and customer experiment, especially where the sustainability label showed a positive but statistically non-significant effect on purchase intention.”
This reflection illustrates a shift from visualisation to interpretation. The students did not treat the dashboard as the final answer. Instead, they connected dashboard insights with regression analysis and customer experiment results. A similar point appeared in another project:
“Power BI gave us hands-on experience in analysing and visualising data in our project. Through the dashboards, we were able to see that revenue varied across different sales channels, brands, and regions, while the regression analysis helped us identify patterns related to sustainability investments and marketing budgets. We also found that products with sustainability labels had slightly higher purchase intentions, but the results were not statistically significant.”
Here, the student described how descriptive visualisation and statistical reasoning supported each other. The dashboard made business variation visible, while the statistical analysis helped them examine possible relationships between sustainability investments, marketing budgets, and performance. Another student also reflected on the value of connecting sustainability, marketing, and sales performance within one decision-making process:
“In our group project, we showed how Power BI can connect sustainability, marketing, and sales performance within one decision-making process. The dashboard helped us identify which product categories, sales channels, and regions contribute most to revenue, while the regression and survey results showed that sustainability matters, but not always as a direct short-term purchase driver. Overall, the project showed us that data analysis is most valuable when it leads to clear business recommendations.”
This captures one of the central learning outcomes of the course. Students learned that sustainability may matter for business, but not always in a simple or immediate way. It may influence customer perceptions, brand value, long-term engagement, or trust, even when the short-term effect on purchase intention is limited or statistically uncertain. A further student reflection emphasised the integration of internal company data, statistical analysis, and customer-level evidence:
“Being part of the company project strengthened my understanding of how ERP data, regression analysis, and customer experiments work together to support data-driven decision-making. Working with Power BI improved my ability to interpret patterns across categories, regions, and sales channels, and helped me see how sustainability labels can influence purchase intention even when the statistical effect is small.”
Taken together, these reflections suggest that students learned to move beyond dashboard production. They practised interpreting patterns, recognising uncertainty, and connecting evidence to business recommendations. The combination of company and customer data was especially important. Internal company data supported analysis of business performance, while customer-level data helped students examine how product information may shape purchase intention. This aligns with the principles of evidence-based management, where decisions are strengthened by combining multiple sources of evidence rather than relying on a single dataset or intuition alone (Rousseau & McCarthy, 2017). It also reflects the growing emphasis on data-driven decision-making, which combines data analysis, business understanding, and evidence from different sources to support managerial decisions (Brynjolfsson & McElheran, 2016; Provost & Fawcett, 2013).
What this means for business education
The course project shows that practical data skills should be integrated across business education. They should not be limited to separate analytics courses, as data is already part of marketing, sustainability, finance, strategy, operations, and customer experience.
There are three main implications. First, students need realistic data tasks. Real business data is rarely perfect - it may be incomplete, messy, or difficult to interpret. Students need to experience this complexity in a guided learning environment. Second, students need to connect analysis with communication. A result has limited value if it cannot be explained. Business graduates must be able to communicate findings to managers, colleagues, customers, and other stakeholders. Third, students need to learn the limits of data. Data can support decisions, but it does not remove uncertainty.
Conclusion
Practical data skills are becoming essential in modern business education because Finnish business life is already data-rich. Companies use digital systems, analytics, cloud services, AI tools, and dashboards. The challenge is no longer only access to data. The challenge is meaningful use. Business students, therefore, need to practise the full cycle of data analytics, starting from defining the problem and collecting the evidence and ending with meaningful managerial recommendations, with an understanding of the limitations of evidence. This kind of learning is relevant for Finland’s labour market and business development as it prepares students to participate in a data economy where evidence, interpretation, and responsibility are increasingly connected.
Authors
Lana Beikverdi, Senior Lecturer in Business, Arcada UAS
Tariq Kamal, Business Management and Transformation student, Arcada UAS
Pijush Dutta, Business Management and Transformation student, Arcada UAS
Sachini Narasinghe Kankanamge, Business Management and Transformation student, Arcada UAS
Afrin Sadat, Business Management and Transformation student, Arcada UAS
References
Brynjolfsson, E., & McElheran, K. (2016). The rapid adoption of data-driven decision-making. American Economic Review, 106(5), 133–139. https://doi.org/10.1257/aer.p20161016
Business Finland. (2025, October 30). Data Economy. https://www.businessfinland.fi/en/services/Programs-and-ecosystems/Programs/data-economy/
Chartered Institute of Personnel and Development [CIPD] (2025, May 19). Evidence-based practice for effective decision-making https://www.cipd.org/en/knowledge/factsheets/evidence-based-practice-factsheet/
European Commission. (2024, July 22). Finland 2024 Digital Decade country report. https://digital-strategy.ec.europa.eu/en/factpages/finland-2024-digital-decade-country-report
Job Market Finland. (2026). Employment and statistics. https://tyomarkkinatori.fi/en/employment-and-statistics
Microsoft. (n.d.). What is Power BI? Microsoft Learn. https://learn.microsoft.com/en-us/power-bi/fundamentals/power-bi-overview
Ministry of Economic Affairs and Employment of Finland. (n.d.). Data economy growth programme. https://tem.fi/en/data-economy-growth-programme
OECD. (2020). Continuous learning in working life in Finland. OECD Publishing. https://doi.org/10.1787/2ffcffe6-en
Provost, F., & Fawcett, T. (2013). Data science and its relationship to big data and data-driven decision making. Big Data, 1(1), 51–59. https://doi.org/10.1089/big.2013.1508
Ridsdale, C., Rothwell, J., Smit, M., Ali-Hassan, H., Bliemel, M., Irvine, D., Kelley, D., Matwin, S., & Wuetherick, B. (2015). Strategies and best practices for data literacy education: Knowledge synthesis report. Dalhousie University. https://dalspace.library.dal.ca/items/ab6d9110-4739-4a74-8b27-4e03b19601e9
Rousseau, D. M., & McCarthy, S. (2017). Educating managers from an evidence-based perspective. Academy of Management Learning & Education, 6(1), 84–101. https://doi.org/10.5465/amle.2007.24401705
Sitra. (2024, January 23). Ensuring European leadership in the data economy. https://www.sitra.fi/en/publication/ensuring-european-leadership-in-the-data-economy/
Statistics Finland. (2025, November 27). Of enterprises 38 per cent used artificial intelligence technologies in 2025. https://stat.fi/en/publication/cm1hnps701dbm07w59uo0jw6u
Business blog
Businesses are part of the solutions for a sustainable future, solutions that combine profitability, environmental concerns and social commitment.
